whoami
Cameron Spilker
Senior Analytics Engineer
I build data systems end to end, from raw API to trusted model to dashboard, and I build them in public.
Scroll
Things I built and still run
Four live projects. Every one of them is something you can use in the next five minutes.
A data pipeline that grades its own forecasts, a newsletter written by AI agents, a card you can send someone today, and a health check for your HOA’s books. Keep scrolling.
01 / 04 · NCAA basketball, ingestion to dashboard, all in the open
Full Data Stack Lab
Every NCAA Division I men's basketball team tracked through the season, the tournament simulated 20,000 times, and a page grading how well the model's own predictions did.
Two dashboards over one set of models: the Evidence pages, where you pick a team and the page answers, and the dbt Charts boards, each of them one YAML file. Start wherever the landing page points you.
02 / 04 · A weekly newsletter written by AI agents
Plainstocks
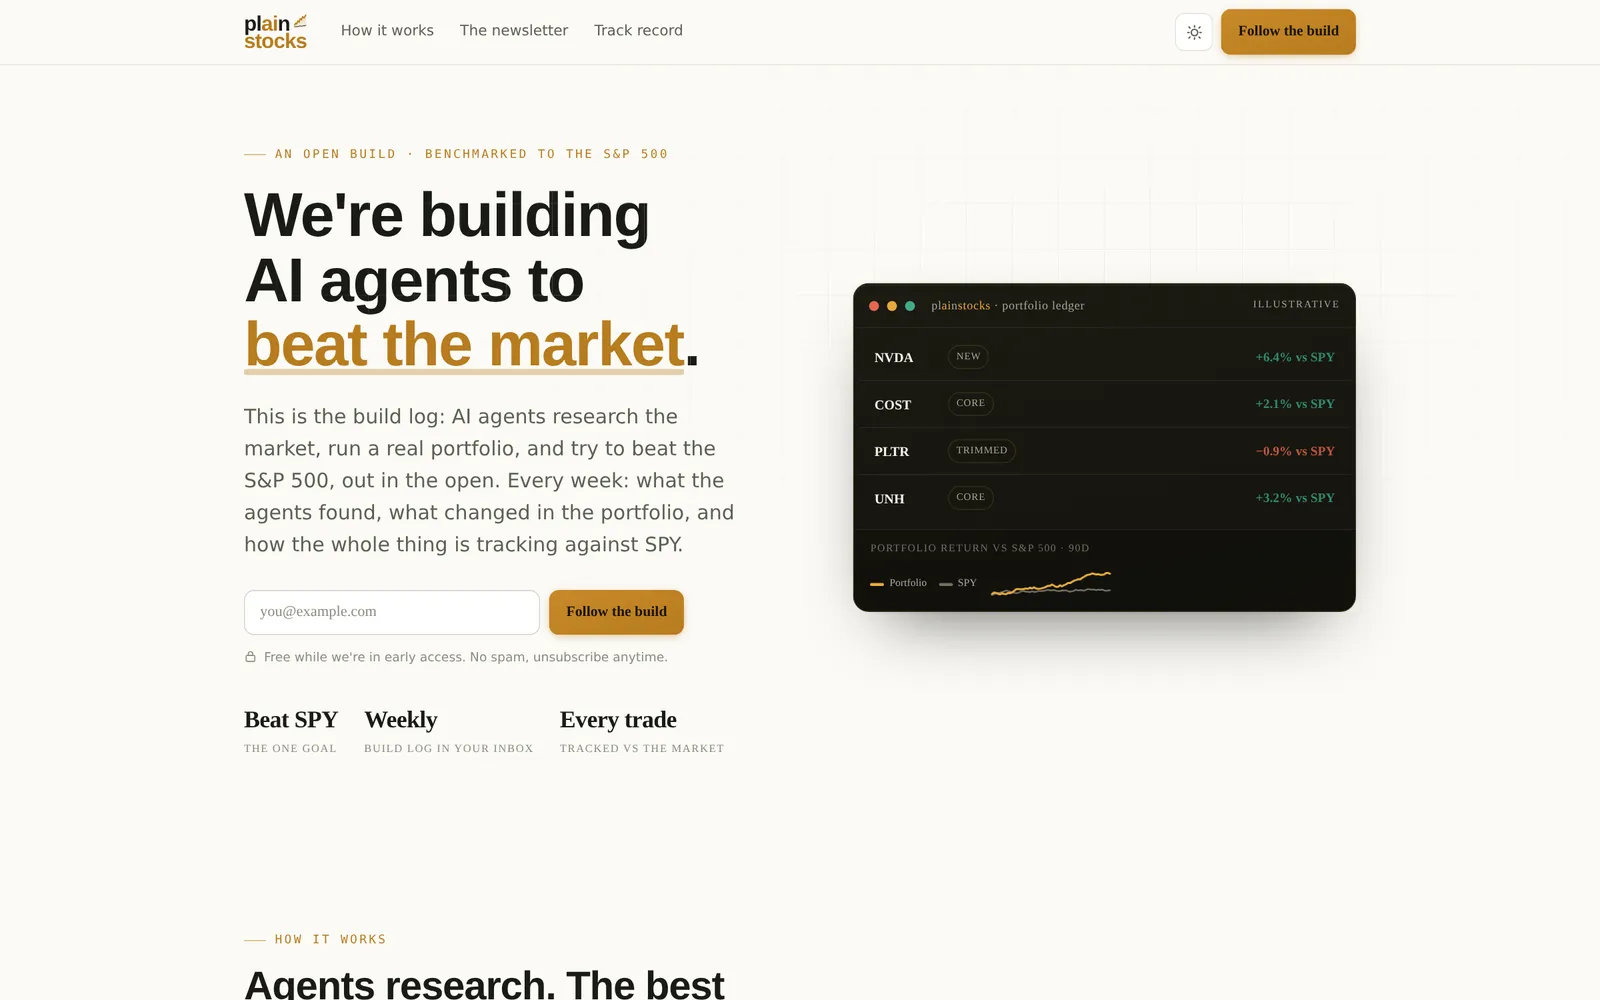
Every week, a team of AI agents manages one simulated portfolio and writes up what it changed, trying to beat the S&P 500 in public.
Free weekly email. Every trade and the running score against the S&P 500.
03 / 04 · Co-founded with my brother Ethan
Cardtacular
Make a digital greeting card in the browser and send it with a link.
No account needed to make one. Text, photos, GIFs, and voice.

04 / 04 · AI financial analysis for HOA boards
HOApulse
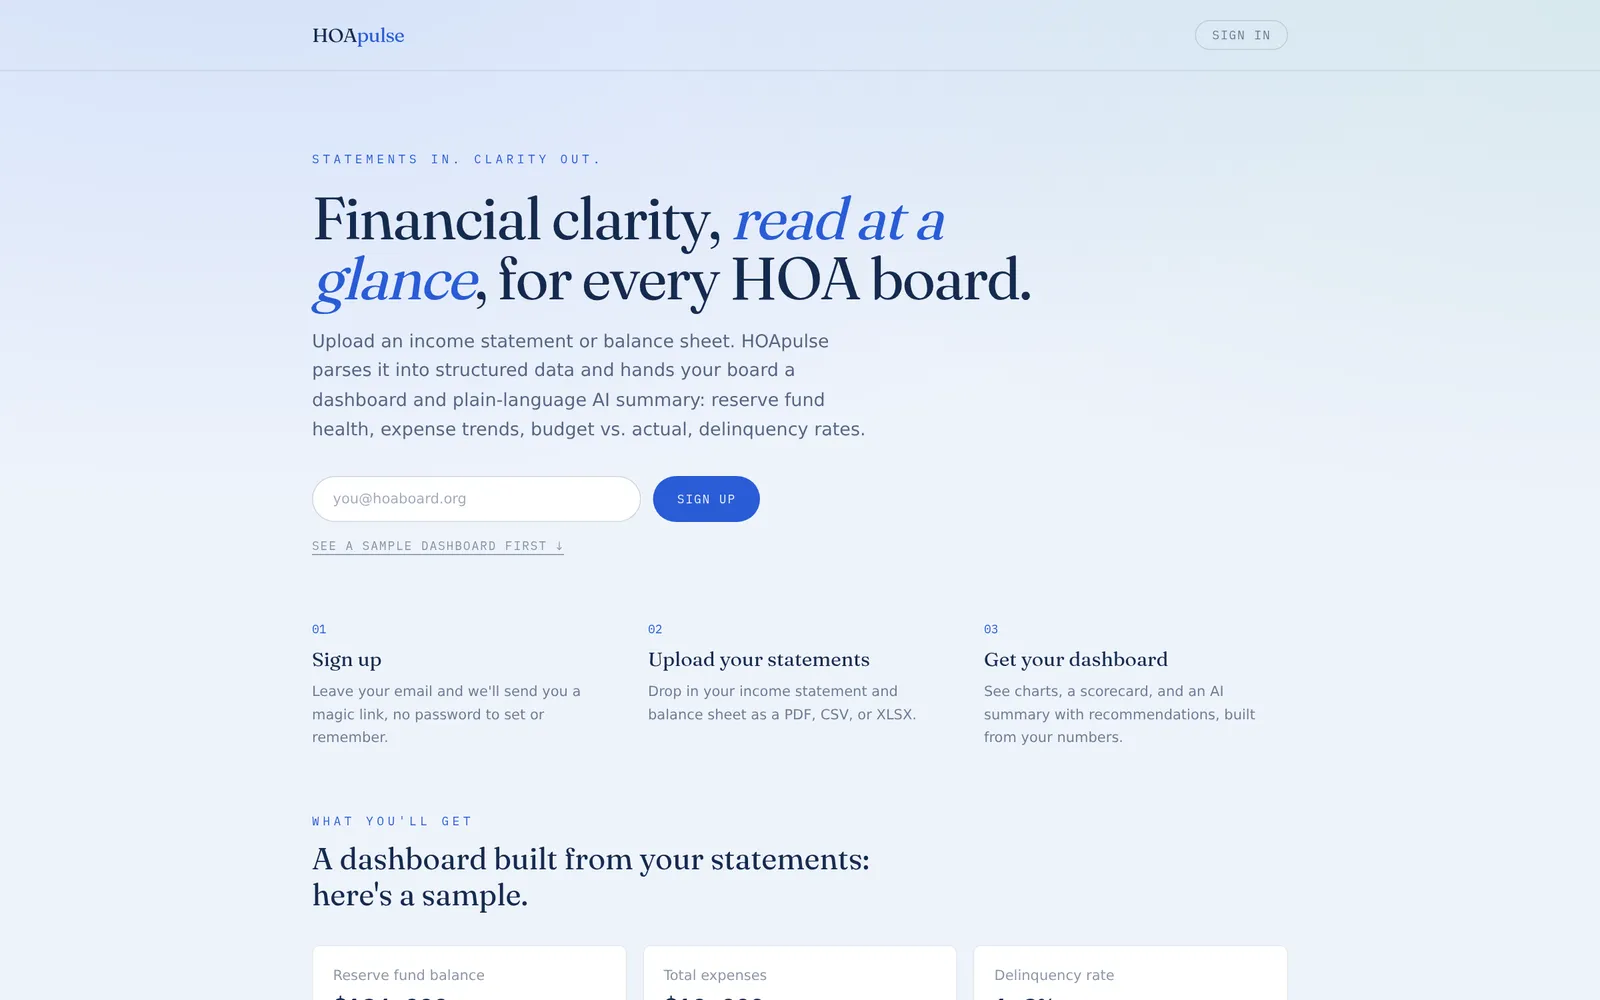
Upload your HOA's financial statements and find out whether its books are healthy.
Upload a statement, get reserve health and budget variance back.
Analytics engineering
The Full Data Stack Lab is live
One repository holding every stage of an analytics stack: the extractors, the warehouse, 23 models and their tests, the orchestrator, and the two dashboards those models exist to serve. The landing page opens onto both.
- dbt models
- 23dbt models
- tests
- 154tests
- simulated brackets
- 20,000simulated brackets
- teams tracked
- 365teams tracked
Two ways in, both reading the same models: the Evidence dashboard, where you pick a team and the page answers, and the dbt Charts boards, where each page is one YAML file. The landing page says what each one is for.
Open the labNext rebuild in
--:--:--
Nightly at 06:00 Mountain · 0 6 * * *
Scores, box scores, betting lines and ratings for the season in progress, then the dbt graph behind them.
What the model likes next
The games that have not been played yet, priced every morning against the betting market. Ranked on disagreement rather than on confidence, because a 95% favourite is 95% on every screen in the country.
Open
The rest of the dashboard
The national table, the projected bracket, conference strength, and a page that grades how well the model's own forecasts did.
Open
How the pipeline is built
Each layer, the tool it uses, and the reason it is that tool. Plus the real Dagster schedules and what each one rebuilds.
Open
The same marts, in dbt Charts
A second presentation layer over the same models, built with dbt Charts. Every board is one YAML file holding its queries, its charts and its layout, rendered to a static page by the pipeline that built the warehouse.
Open
The dbt docs and lineage
Every model, its columns, its tests, and the graph connecting them, generated from the project itself.
Open
Every line of the source
Ingestion, warehouse, models, orchestration and dashboard, in one repository with the CI that runs them.
Open
Tools
Things I needed, so I built them
Every one of these runs entirely in your browser. Nothing you load is uploaded anywhere, which is the only way a tool that reads a work artifact is worth using at work.
The same rule as everything else here: if it reads a file you would not hand to a stranger, it has no server to hand it to. These parse in the page and forget it when you close the tab.
All toolsExperience
Nine years of making numbers defensible.
Analytics engineering at Typeform, Apollo.io, and Gopuff, with data engineering and audit analytics before that. The through line is migrations, cost, and trust: the work that makes a dashboard, or an AI answer, worth relying on.
Full history on LinkedIn →Oct 2024 to Present
Typeform
Senior Analytics Engineer
- Launched conversational analytics on the Omni semantic layer, giving stakeholders natural language access to governed metrics. Built reusable components into the dbt repo and run evals on the context behind them to keep answers accurate.
- Co-led a zero-downtime migration of 650+ dbt models and 600+ Looker assets, seven years of reporting and operational data, from Redshift to Snowflake.
- Led the Looker to Omni migration of 400+ dashboards and 75+ Explores, prioritized by real usage and delivered with an external team. Now the Omni admin for access, permissions, and user content.
- Built feature-level reporting end to end: consolidated eventing data, defined the key properties, and shipped the dbt models, semantic layer, and dashboards. Scaled from an MVP of 7 features to 145 in production.
- Introduced macros, DRY doc blocks, PR templates, and CI/CD with automated summaries and data diffs, cutting review cycles ~25% across a four person analytics engineering team.
dbtSnowflakeOmniSemantic layerAICI/CDSep 2023 to Oct 2024
Apollo.io
Senior Analytics Engineer
- Cut CI/CD runtime from 60 minutes to 6 through code diffing and smart caching, accelerating PR feedback for 10+ analytics engineers.
- Re-engineered 50+ dbt models and 150+ Looker assets after major Salesforce architecture changes, restoring accuracy across 20+ dashboards used by Sales, Finance, Customer Success, and Marketing.
- Streamlined reverse ETL syncs, reducing processed records from 6 million to 1.8 million and sync duration from 30+ hours to under 1, lowering compute cost and improving freshness.
- Led a company wide doc-a-thon that raised dbt documentation coverage from 46% to 85%, improving discoverability and onboarding.
dbtSnowflakeLookerCensusSalesforceMar 2022 to Sep 2023
Gopuff
Analytics Engineer
- Achieved $300K+ in annualized savings by optimizing Snowflake queries and pipelines across core analytics workloads.
- Designed centralized subject area models for the Growth and Product Analytics teams covering search, ads, impressions, marketing performance, and competitive pricing, increasing consistency across 10+ core metrics.
- Built and maintained Looker and Sigma dashboards enabling self serve analytics for hundreds of internal users, reducing ad hoc report requests ~25%.
dbtSnowflakeLookerSigma
Before that
- 2025Brigham Young University · Adjunct Professor, IS 515 Advanced Spreadsheets
- 2021 to 2022Lendio · Data Engineer
- 2019 to 2021American Express · Data Analytics & Innovation Analyst
- 2019Xerva, an Eide Bailly company · Business Intelligence Developer
- 2017 to 2019Brigham Young University · Associate Audit Analyst
- 2018KPMG · Advisory Intern
About
Who I am
I am an analytics engineer based in Utah. I work across the whole stack: pulling from raw APIs, modeling in dbt, orchestrating the runs, and shipping the dashboard people actually open. The parts I care most about are the unglamorous ones. Tests, lineage, and documentation are what make a number defensible.
I work AI-forward. I treat models as a way to move faster through the mechanical parts so more of my attention goes to the judgment calls: what to measure, what to trust, and what to throw away.
I studied information systems at BYU and taught spreadsheets there. Mostly I like building things with AI and working with data, and I am always happy to talk with people doing either. If something here is useful to you, or you want to compare notes on any of it, get in touch.
- Based in
- Utah
- Studied
- Information Systems, BYU (BS + MS)
- Taught
- IS 515, Advanced Spreadsheets, at BYU
- Tools
- dbt · Snowflake · Looker · Omni · Python